All about Solana’s short-lived ascent to $89

- SOL’s price jumped by 10% on the 24 of January after meme coin Dogwifhat got listed on Bitget.
- However, it has since reversed some of these gains.
Solana [SOL] traders will remember that the token had declined to a five-week low of $78.60 on the 23rd of January. However, this was reversed on the 24th of January, as the asset saw a 10% uptick in its value.
The price surge came after popular Solana-based meme coin Dogwifhat [WIF] saw a 30% intraday price hike following news that it would be listed on crypto exchange Bitget.
? New Listing @dogwifcoin#Bitget will list WIF/USDT on Jan 24, 8:00 UTC. Deposit now!
? A total $100 #giveaway for 10 members! Just follow RT & tag 3 friends.
Listing – https://t.co/Rf0WnGAYDI
Campaign – https://t.co/tyDGyifbfY— Bitget (@bitgetglobal) January 24, 2024
While WIF’s value has soared by almost 60% in the last 24 hours, SOL has managed a 4% rise during the same period, according to data from CoinMarketCap.
However, the double-digit decline in the coin’s trading volume hinted at the possibility of a downtrend.
Keep your SOL safe
A bearish divergence between an asset’s price and volume suggests a lack of conviction among market participants.
Situations such as this are usually followed by a price reversal or a period of consolidation till sentiment improves.
For SOL’s Weighted Sentiment to improve, bulls must regain market control. An assessment of the coin’s price movements on a daily chart revealed that coin sellers had the upper hand.
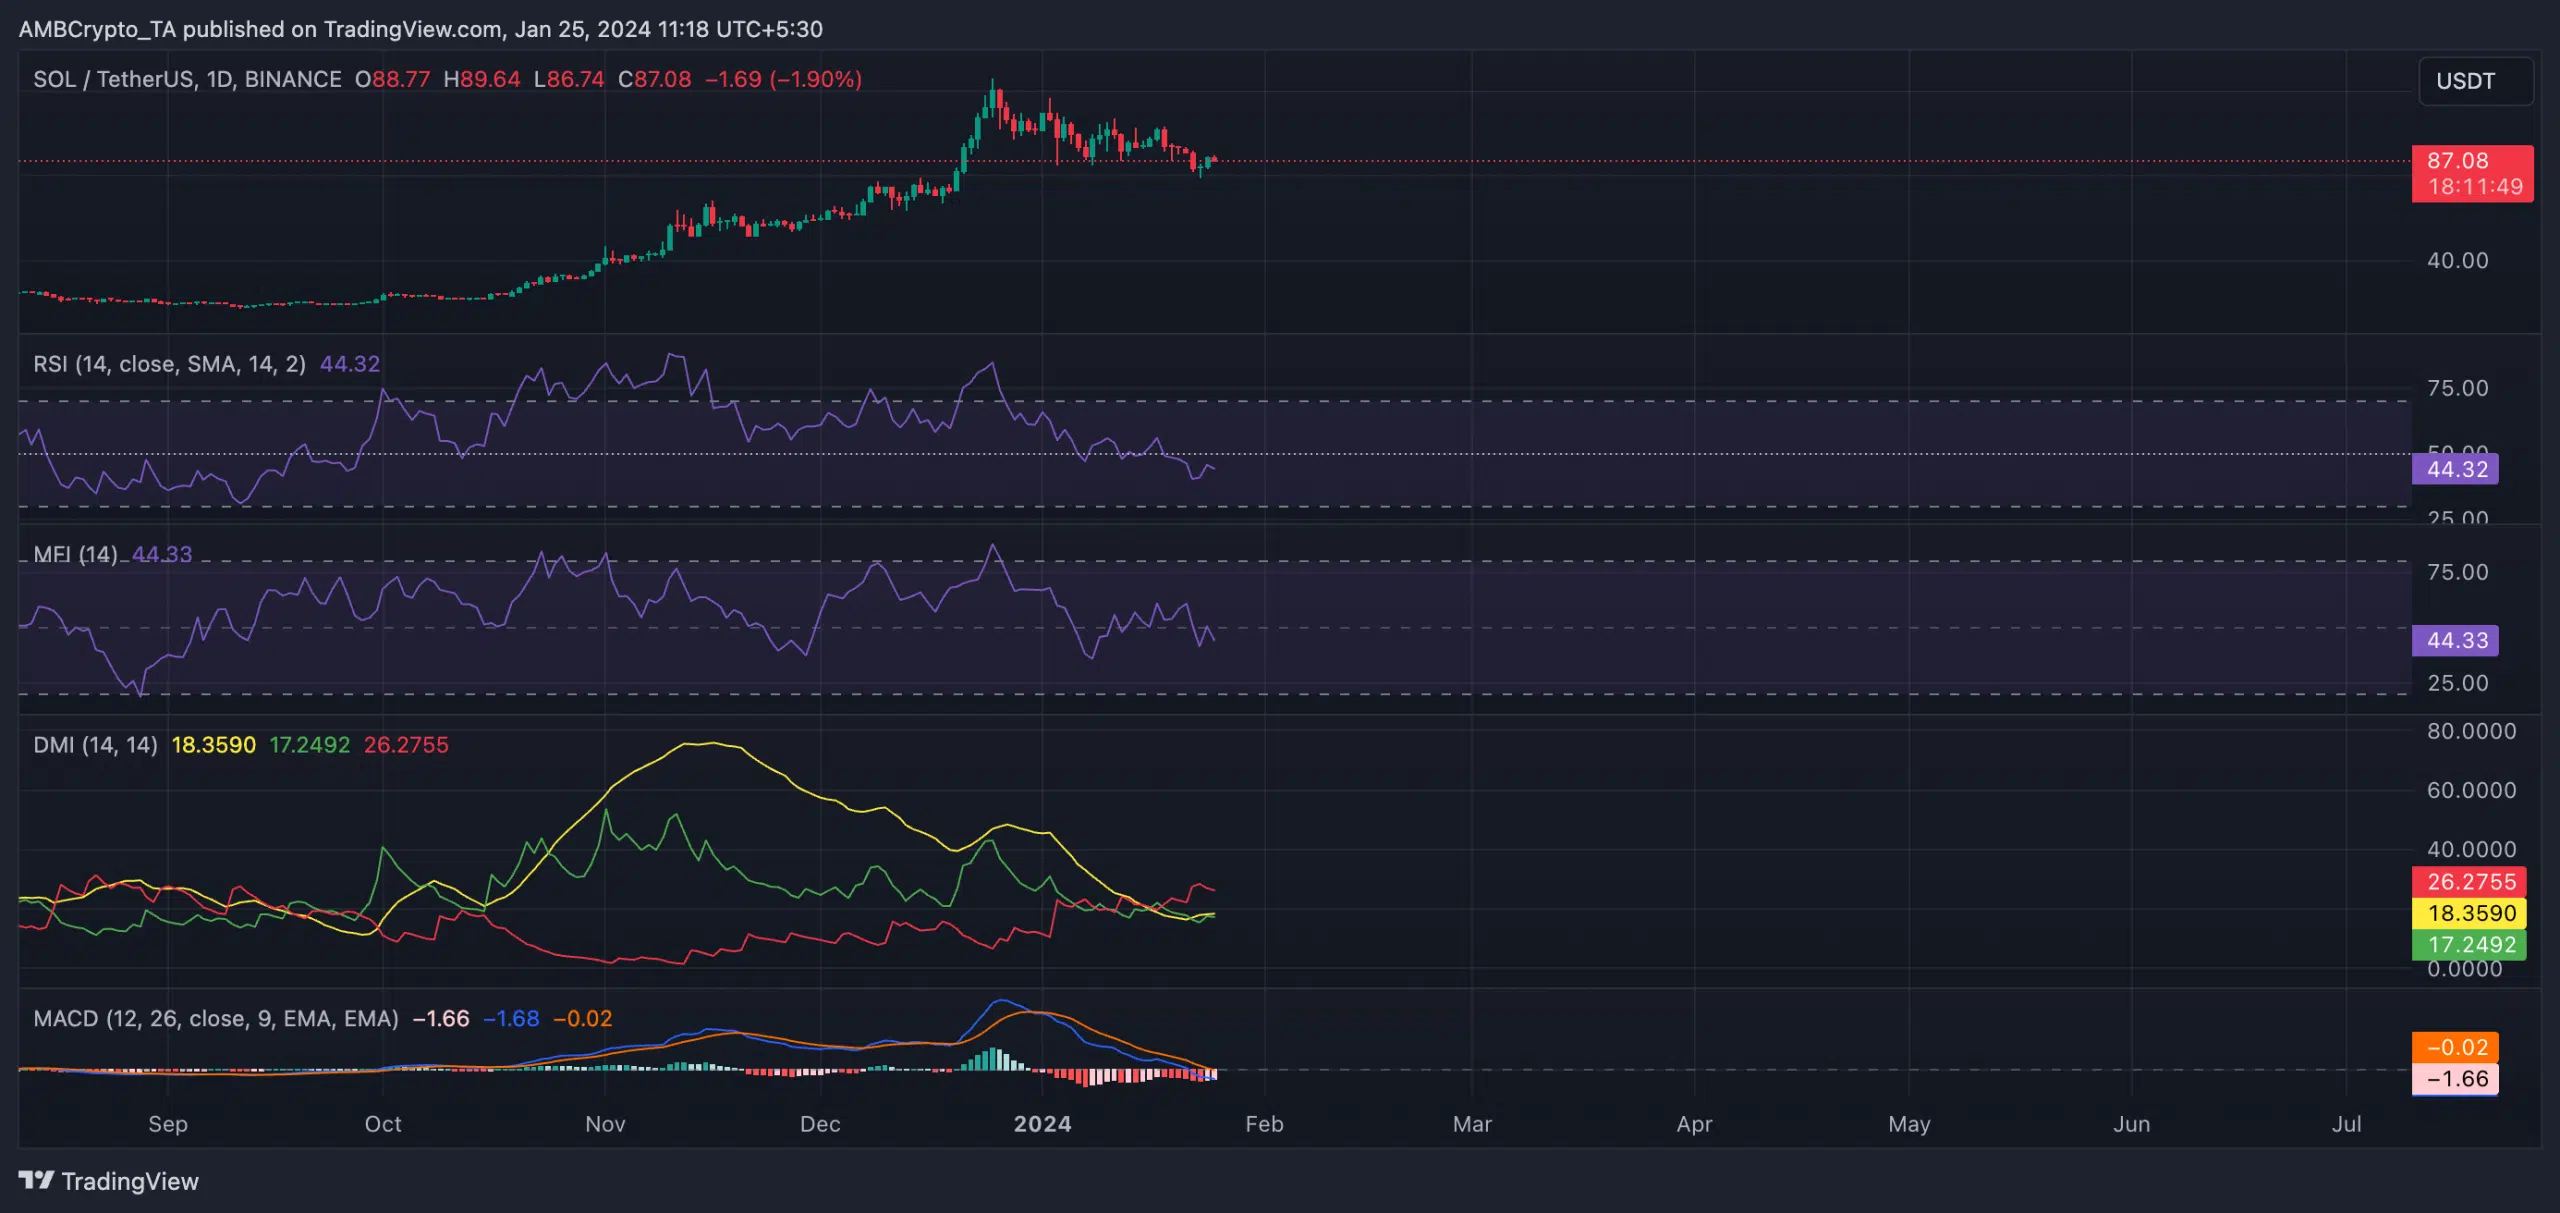
For example, readings from SOL’s Moving average convergence/divergence (MACD) at press time showed the MACD line resting below the trend line.
Also spotted below zero, this showed that the 12-period EMA was below the 26-period EMA, suggesting that the coin’s short-term momentum was weaker than the long-term momentum.
Confirming that the bears had market control, the positive directional index (green) of the coin’s Directional Movement Index (DMI) indicator was under its negative directional index (red).
The positions of these lines suggested that the bears’ power exceeded that of the bulls, as coin sell-offs continued to outpace accumulation.
Further, depicting the fall in SOL accumulation, its key momentum indicators trended downwards to return values less than 50 at press time.
For example, SOL’s Money Flow Index (MFI) was 44.32 at press time, while its Relative Strength Index (RSI) was 44.33.
At these values, these indicators showed that SOL traders preferred to sell rather than accumulate more coins.
The market is “stable”
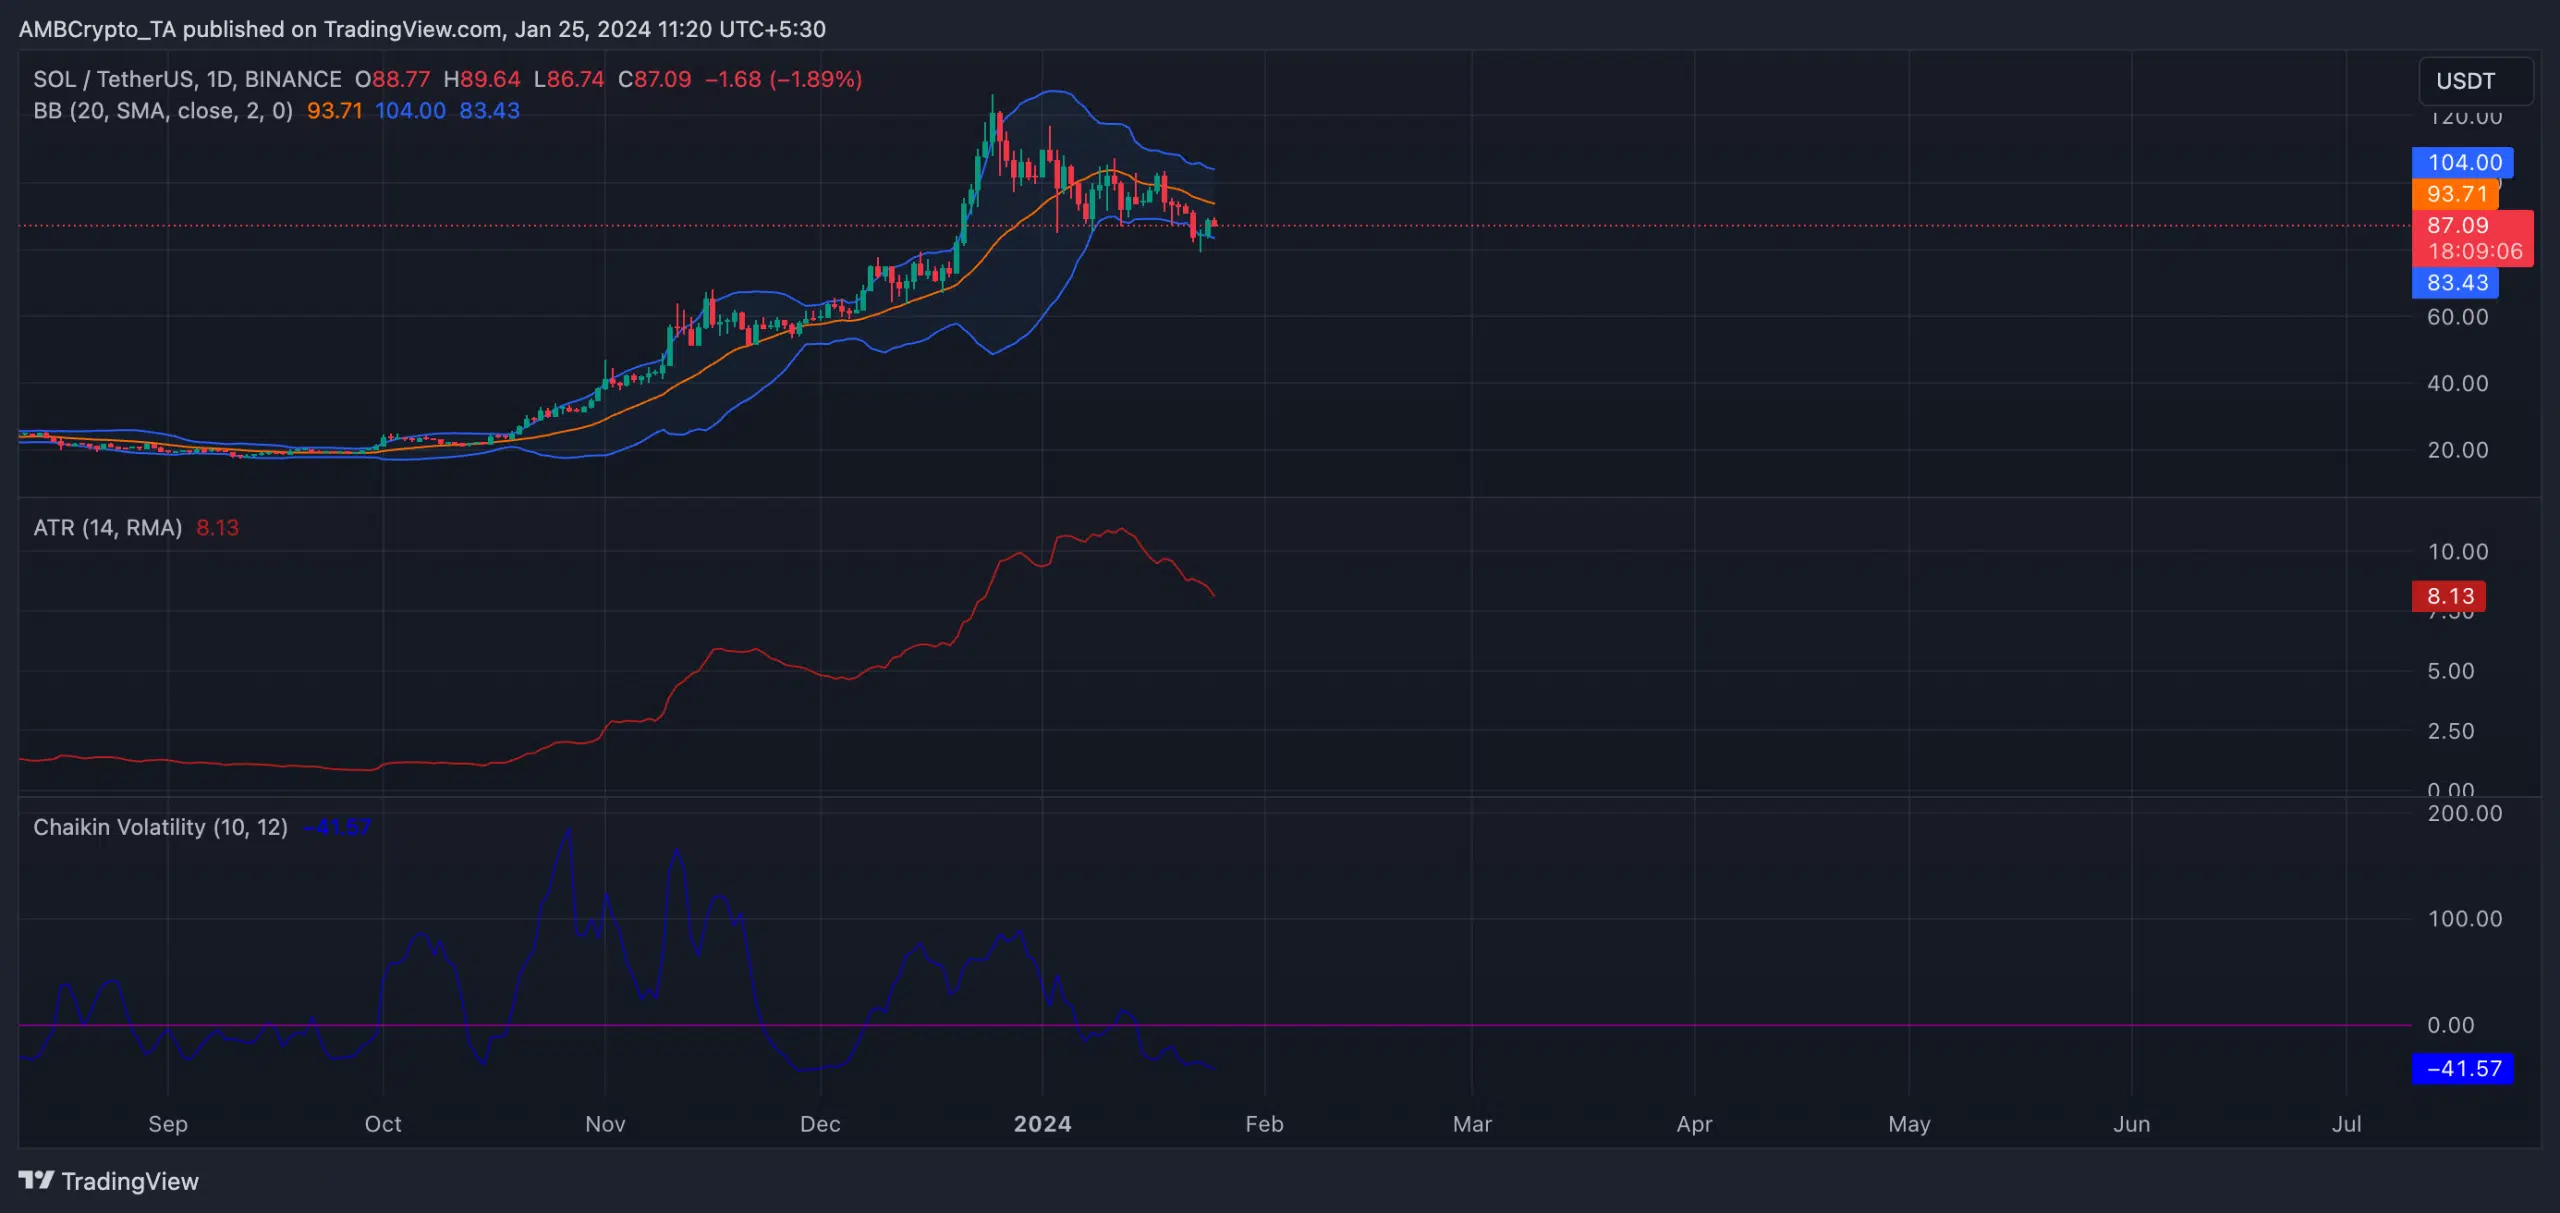
While the prices of leading crypto assets Bitcoin [BTC] and Ethereum [ETH] remain prone to swings, an assessment of SOL’s volatility markers revealed the presence of low market volatility.
How much are 1,10,100 SOLs worth today?
For one, the gap between its Bollinger Bands indicator’s upper and lower bands has narrowed in the last week. This squeeze shows that the asset is experiencing a period of reduced price swings or uncertainty.
Also, SOL’s Average True Range (ATR) has trended downward during the same period, showing a decline in price volatility.


