Binance, Polygon lead in this area, but struggle in others – why?

- Binance and Polygon saw more unique addresses than other chains.
- TVL and volume reduced despite the number of unique addresses.
Recent data indicates that Binance [BNB] and Polygon [MATIC] have had the most active addresses. Still, it’s essential to analyze how this has influenced their volumes and Total Value Locked (TVL).
Additionally, how have BNB and MATIC trended with their networks’ volume of unique addresses?
Binance and Polygon lead rankings
In a recent ranking of top blockchains by unique addresses conducted by Crypto Rank, the Binance Smart Chain and Polygon claimed the top two positions.
According to data from the ranking platform, the Binance Smart Chain had over 444 million unique addresses, while Polygon had over 419 million.
These figures are noteworthy, as the combined total of unique addresses on these platforms surpassed the total volume of unique addresses on the next three platforms.
Furthermore, they outpaced major platforms like Ethereum [ETH] regarding unique addresses, indicating significant user adoption and activity.
Any impact on volume and TVL?
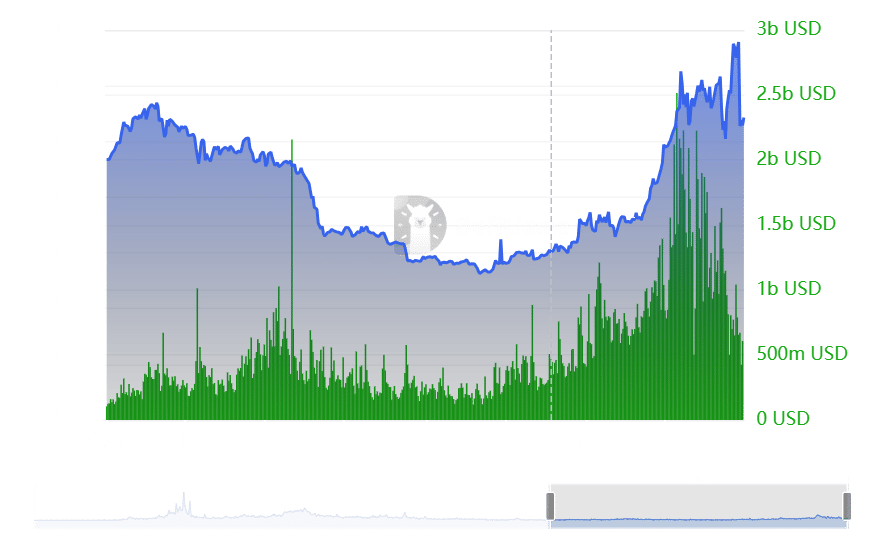
Analysis of the volume and Total Value Locked (TVL) on the Binance Smart Chain (BSC) using DefiLlama data revealed a lack of significant recent movements.
The network experienced notable activity around March, marked by consecutive spikes in volume, peaking at over $2.5 billion. However, as of the latest data, the volume has decreased to approximately $614 million.
Similarly, the TVL saw a brief spike, reaching over $6.7 billion in the past week, but has since declined to around $5.4 billion.
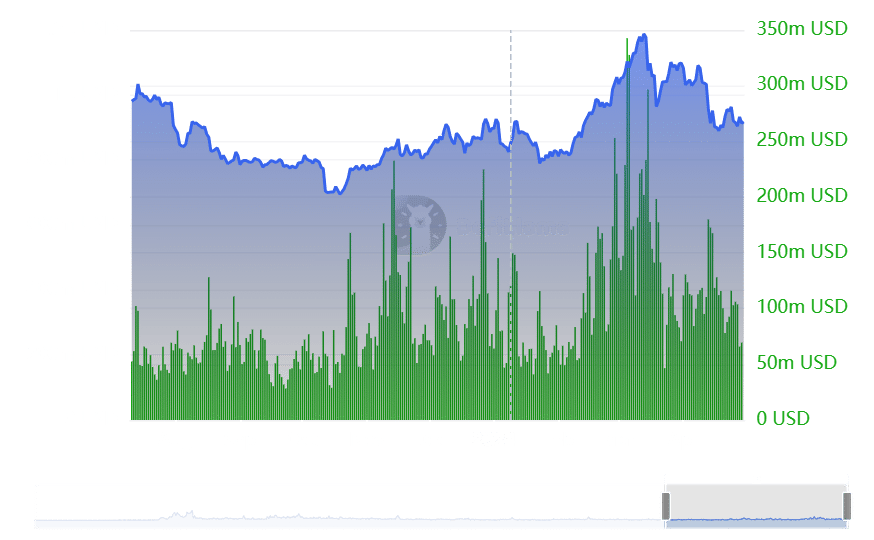
Similarly, AMBCrypto’s examination of the volume and TVL on Polygon indicated a lack of recent notable trends.
At the time of analysis, the volume was approximately $69 million, with a recent decline observed. The TVL also stood at around $917 million, showing a recent decline.
These metrics suggest that despite the surge in unique addresses, there has yet to be a corresponding increase in activity or engagement on these networks.
BNB and MATIC see a negative start to the week
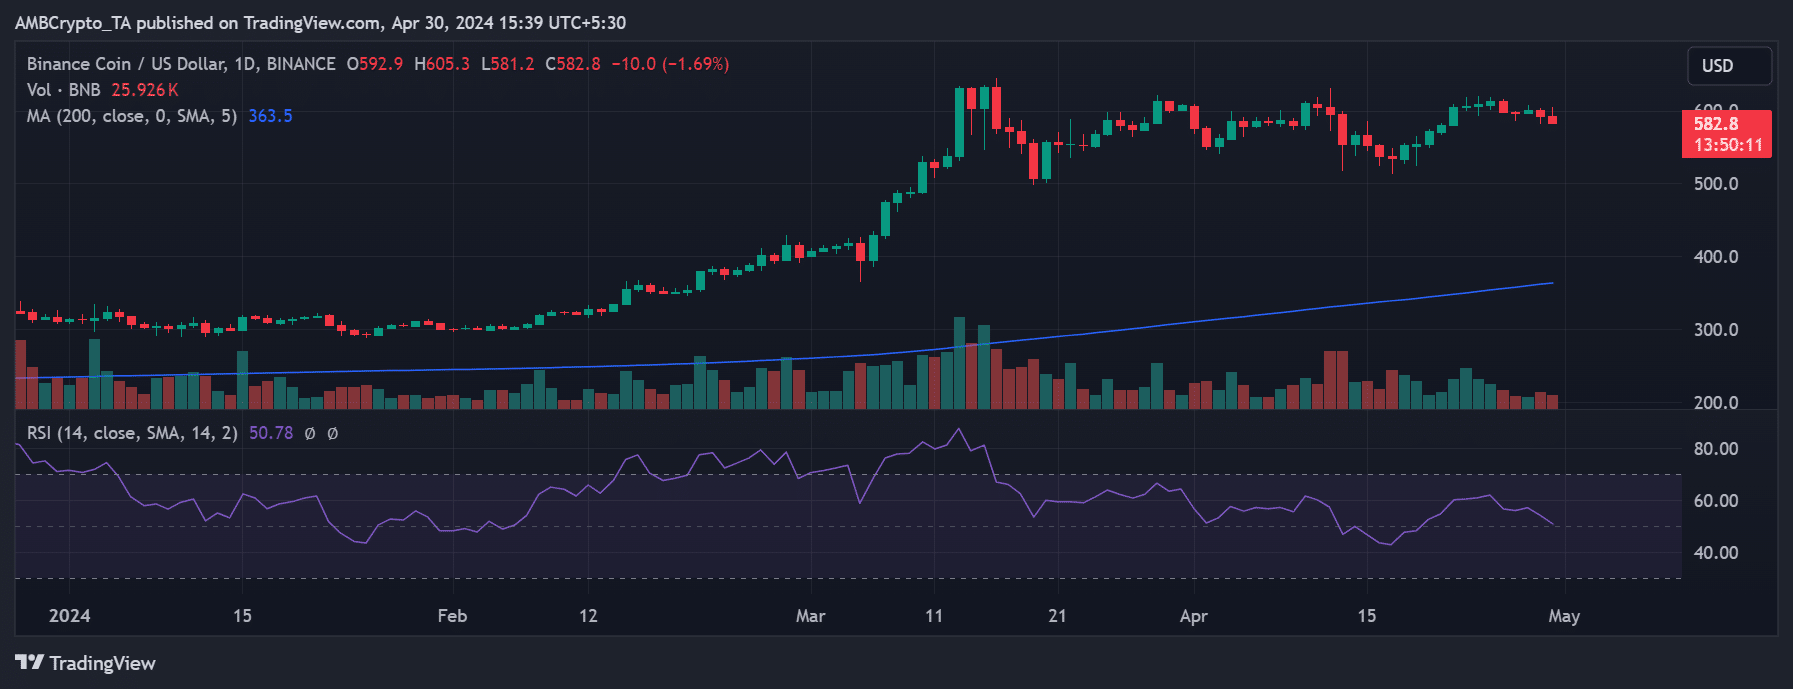
AMBCrypto’s analysis of BNB indicated a departure from its positive start to the week, as the coin experienced a decline in trading.
On the 29th of April, BNB concluded trading with a 1.23% decrease, trading at approximately $592.7. As of this writing, there was a further 1.72% decrease, resulting in a trading price of around $582.9.
Realistic or not, here’s BNB market cap in BTC’s terms
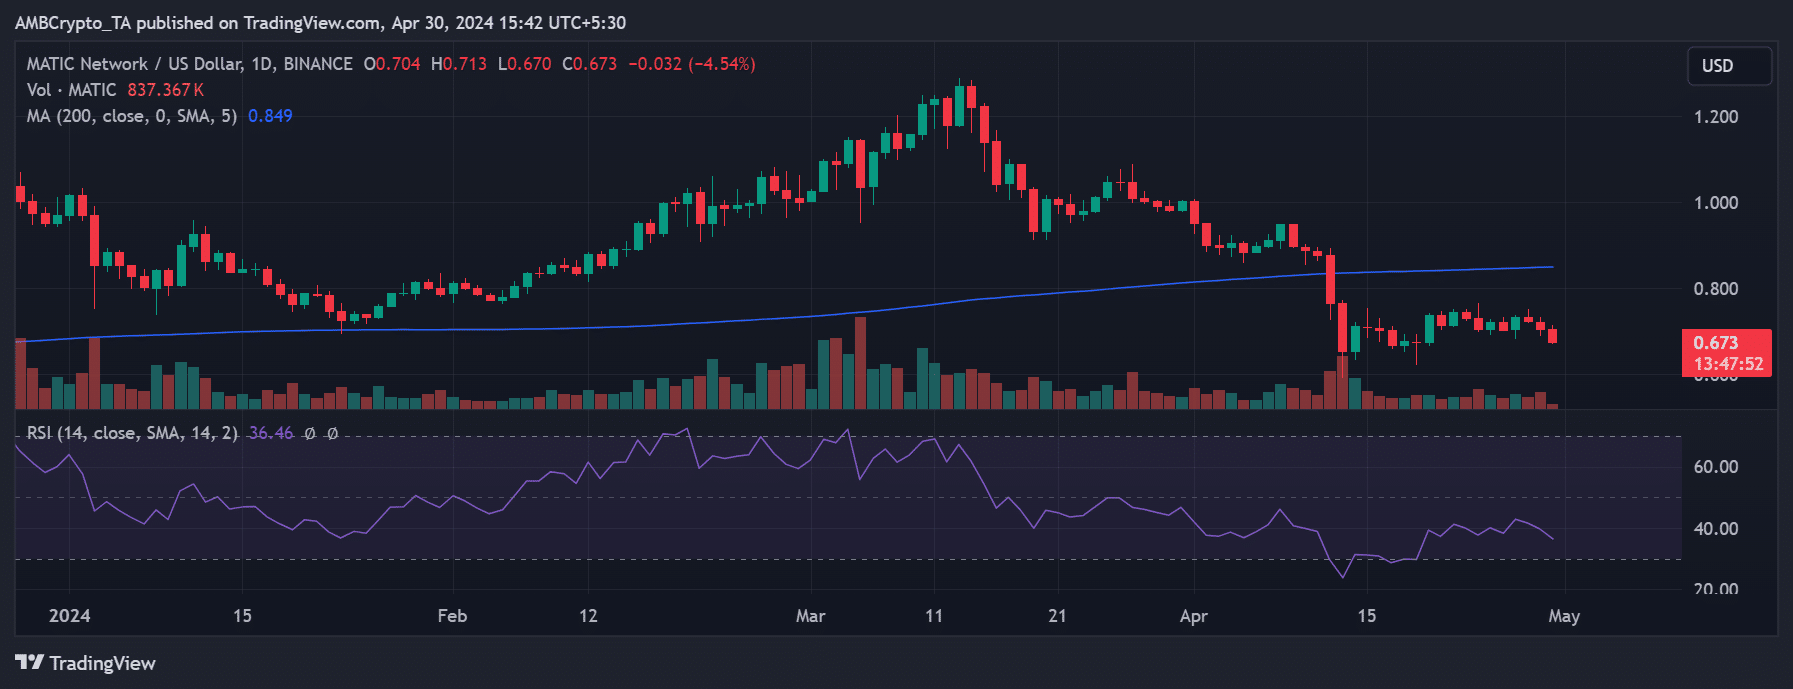
Similarly, MATIC exhibited a more negative trend, with a downward trajectory observed since the beginning of the week.
At the time of analysis, MATIC was trading at approximately $0.67, reflecting a decline of over 4%.

