Bitcoin liquidation heatmap watch – Could BTC drop to $60K?

- Despite the recent price decline, BTC’s number of long-term holders increased.
- In case of a bullish takeover, then BTC might first reclaim $68k.
Bitcoin [BTC] registered a major drop in the last 24 hours as it failed to retest its all-time high, which several expected. However, in the past few hours, BTC has somewhat consolidated near $66.
Let’s have a look at Bitcoin liquidation heatmap to find out its upcoming targets.
Bitcoin’s recent downfall
CoinMarketCap’s data revealed that BTC’s price dropped by over 4% in the last 24 hours. At the time of writing, the king coin was getting comfortable near $66k with a market capitalization of over $1.31 trillion.
AMBCrypto’s look at IntoTheBlock’s data revealed that despite the recent setback, BTC’s number of long-term holders (addresses holding BTC for more than 1 year) was increasing.
AMBCrypto’s look at CryptoQuant’s data revealed that its binary CDD was green. This meant that long-term holders’ movement in the last seven days was lower than the average. They have a motive to hold their coins.
Another bullish metric was the funding rate, which increased. However, not everything was in BTC’s favor.
For instance, as per Coinglass’ data, BTC’s long/short ratio registered a massive dip. A drop in the market suggested that there are more short positions in the market than long positions.
This indicated that bearish sentiment around the king of cryptos has increased.
Upcoming targets for BTC
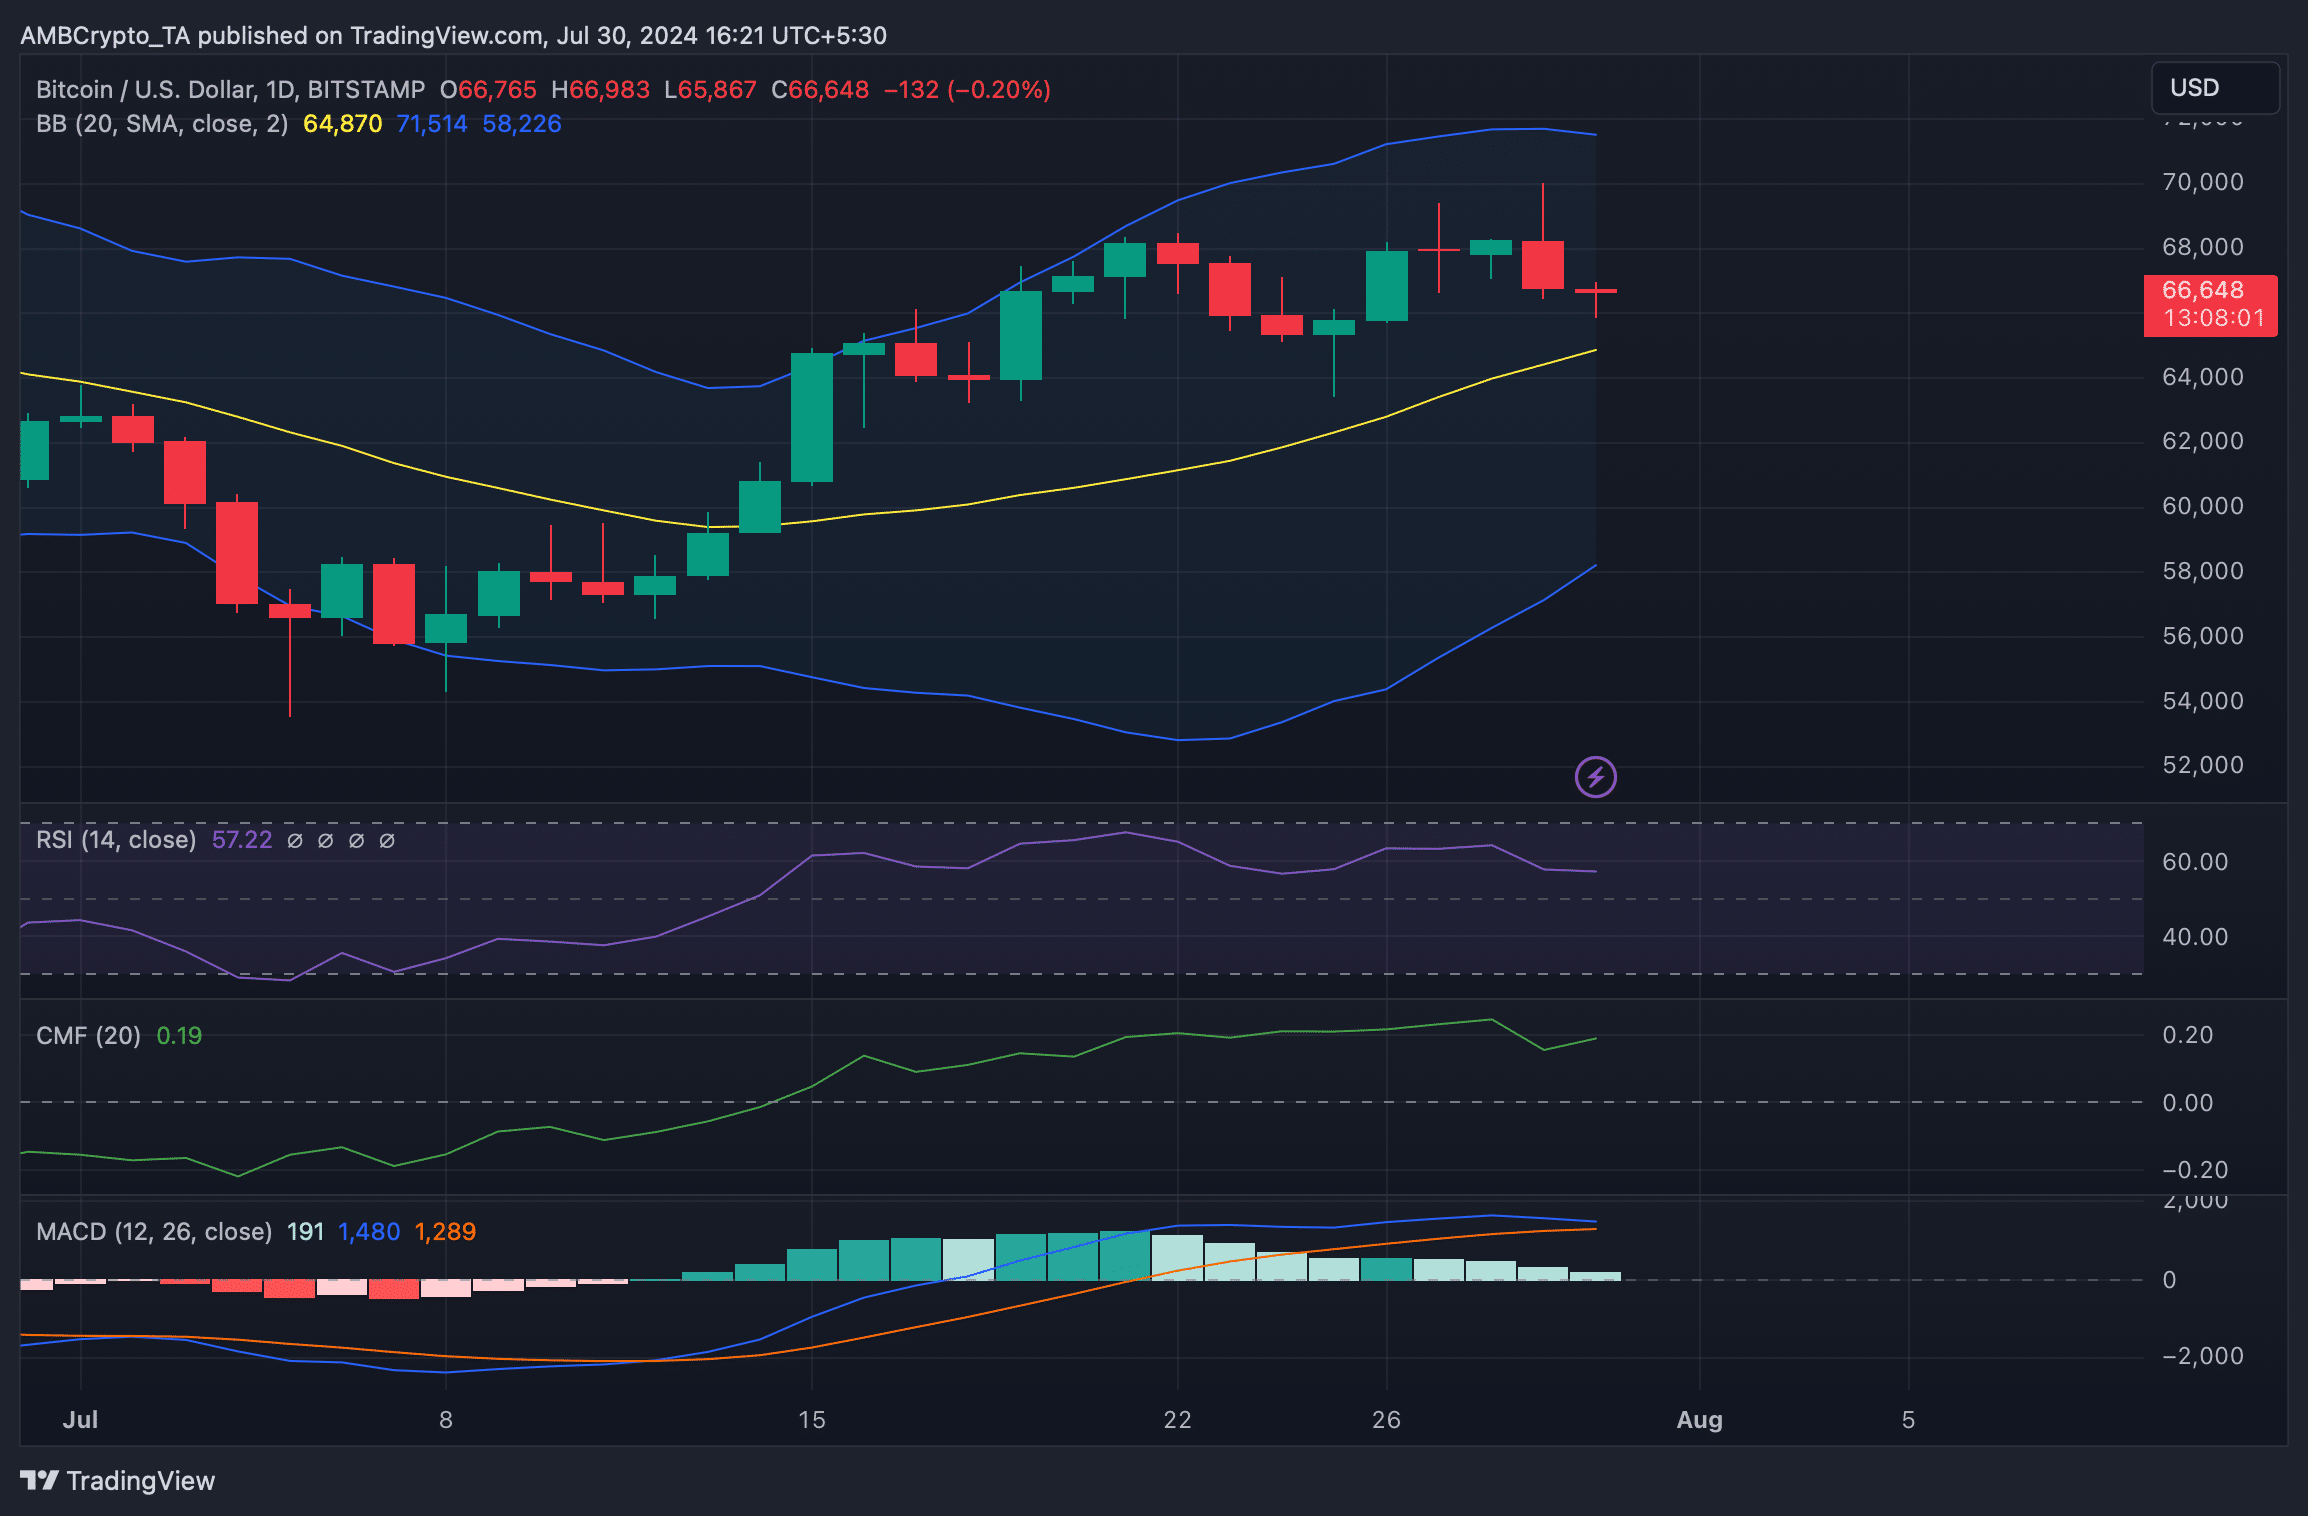
AMBCrypto then checked BTC’s daily chart to see which way BTC was headed in the coming days. The Relative Strength Index (RSI) took a sideways path, hinting at a few more days of consolidation.
The technical indicator MACD also had a similar reading as it displayed the possibility of a bearish crossover.
Nonetheless, the Bollinger Bands revealed that BTC was about to test its 20-day Simple Moving Average (SMA). Bitcoin might as well manage to successfully test the support as the Chaikin Money Flow (CMF) registered an uptick.
We then took a look at Bitcoin liquidation heatmap to find out its upcoming targets. If the bear rally continues, then it won’t be surprising for BTC to drop to $65k first as liquidation would rise.
A further plummet under that might push BTC down to near the $60k range.
Read Bitcoin’s [BTC] Price Prediction 2024-25
However, in case of a trend reversal, BTC might reclaim $68k before it eyes at retesting its ATH.
If BTC manages to retest its ATH, then it would be interesting to see whether it can go above that.


